library(groupedHyperframe)2 Grouping ppp-Hypercolumn
The examples in Chapter 2 require
search path & loadedNamespaces on author’s computer
search()
#  [1] ".GlobalEnv"                "package:groupedHyperframe" "package:stats"             "package:graphics"          "package:grDevices"         "package:utils"             "package:datasets"
#  [8] "package:methods"           "Autoloads"                 "package:base"
loadedNamespaces() |> sort.int()
#  [1] "abind"             "base"              "cli"               "cluster"           "codetools"         "compiler"          "datasets"          "deldir"            "digest"
# [10] "doParallel"        "dplyr"             "evaluate"          "farver"            "fastmap"           "fastmatrix"        "foreach"           "generics"          "geomtextpath"
# [19] "GET"               "ggplot2"           "glue"              "goftest"           "graphics"          "grDevices"         "grid"              "gridExtra"         "groupedHyperframe"
# [28] "gtable"            "htmltools"         "htmlwidgets"       "iterators"         "jsonlite"          "knitr"             "lattice"           "lifecycle"         "magrittr"
# [37] "Matrix"            "matrixStats"       "methods"           "nlme"              "otel"              "parallel"          "patchwork"         "pillar"            "pkgconfig"
# [46] "polyclip"          "pracma"            "R6"                "RColorBrewer"      "rlang"             "rmarkdown"         "rstudioapi"        "S7"                "scales"
# [55] "SpatialPack"       "spatstat.data"     "spatstat.explore"  "spatstat.geom"     "spatstat.random"   "spatstat.sparse"   "spatstat.univar"   "spatstat.utils"    "splines"
# [64] "stats"             "survival"          "systemfonts"       "tensor"            "textshaping"       "tibble"            "tidyselect"        "tools"             "utils"
# [73] "vctrs"             "viridisLite"       "xfun"              "yaml"
In Chapter 2, the author
- creates a grouped hyper data frame with one-and-only-one point-pattern (
ppp) hypercolumn (Section 2.1); - discusses the batch processes of spatial point-pattern analyses applicable to the one-and-only-one point-pattern hypercolumn of a (grouped) hyper data frame (Section 2.2);
- summarizes the results of the batch-processes (Section 2.3)
- aggregates the summary statistics over the nested grouping structure (Section 2.4).
2.1 Creation
Listing 2.1 creates a grouped hyper data frame s with one-and-only-one (Section 25.13) point-pattern (ppp, Chapter 35) hypercolumn from the data frame wrobel_lung. This process (Chapter 44)
- takes a data frame
wrobel_lungas input; - creates a point-pattern hypercolumn
ppp.from the \(x\)- and \(y\)-coordinates, the numeric markhladrand the multi-type markphenotype, perimage_idnested withinpatient_id; - aggregates other variables of interest, e.g.,
OS,genderandage, at the level ofimage_idnested withinpatient_id. Those variables must be identical within the nested grouping structure~patient_id/image_id; - returns a grouped hyper data frame
s.
ppp-hypercolumn
s = wrobel_lung |>
   grouped_ppp(formula = hladr + phenotype ~ OS + gender + age | patient_id/image_id, data = _, coords = ~ x + y)
Readers may view the grouped hyper data frame s (Listing 2.1) by simply typing s at the R console prompt and pressing Enter (Listing 2.2),
s (Listing 2.1)
s
# Grouped Hyper Data Frame: ~patient_id/image_id
#
# 15 image_id nested in
# 3 patient_id
#
#       OS gender age    patient_id          image_id  ppp.
# 1  3488+      F  85 #01 0-889-121 [40864,18015].im3 (ppp)
# 2  3488+      F  85 #01 0-889-121 [42689,19214].im3 (ppp)
# 3  3488+      F  85 #01 0-889-121 [42806,16718].im3 (ppp)
# 4  3488+      F  85 #01 0-889-121 [44311,17766].im3 (ppp)
# ✂️ --- output truncated --- ✂️
Also, readers may view the summary information of the grouped hyper data frame s (Listing 2.1) using the function summary() (Listing 2.3),
s (Listing 2.1)
s |>
summary()
# Grouped Hyper Data Frame: ~patient_id/image_id
#
# 15 image_id nested in
# 3 patient_id
#
# OS gender age patient_id image_id ppp.
# (Surv) (factor) (numeric) (factor) (factor) (ppp)
# <time-to-event> :(Surv) F: 5 Min. :66.00 #01 0-889-121:5 [36953,13765].im3:1
# [right-censored]:5 M:10 1st Qu.:66.00 #02 1-037-393:5 [39206,15250].im3:1
# [observed] :10 Median :84.00 #03 2-080-378:5 [40242,17359].im3:1
# Mean :78.33 #04 2-223-153:0 [40863,16444].im3:1
# 3rd Qu.:85.00 #05 2-286-740:0 [40864,18015].im3:1
# Max. :85.00 #06 2-306-657:0 [41191,13764].im3:1
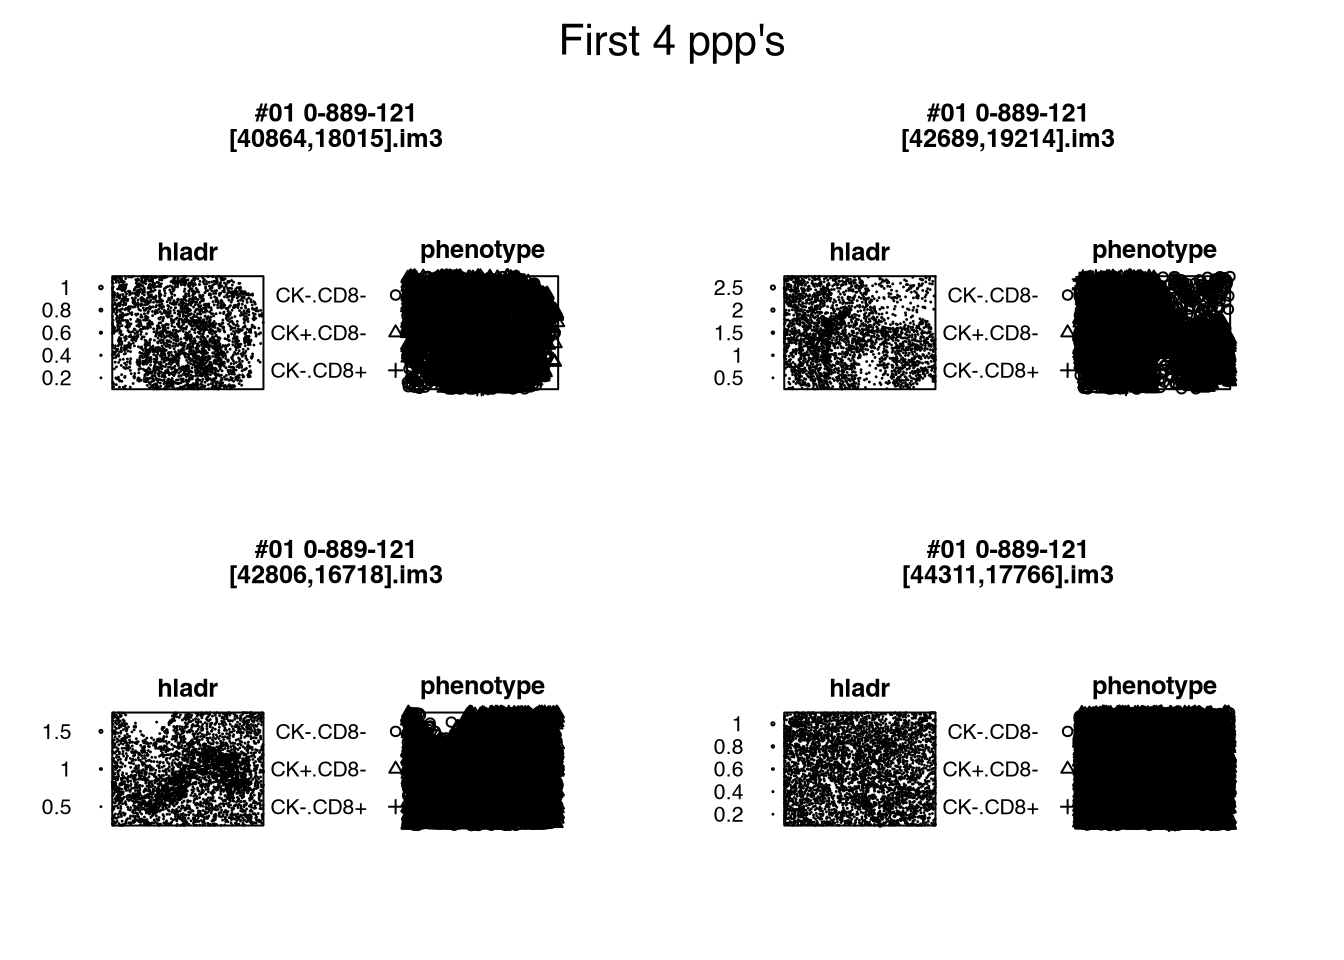
# (Other) :0 (Other) :9Figure 2.1 visualizes the one-and-only-one point-pattern hypercolumn s$ppp. using package spatstat.geom (v3.7.0.8); further details are provided in Section 25.2.
s$ppp. (Listing 2.1)
Code
s[1:4, ] |> # first 4 rows
  spatstat.geom::plot.hyperframe(
    e = quote(plot(ppp., main = paste(patient_id, image_id, sep = '\n'))),
    main = "First 4 ppp's"
)s$ppp. (Listing 2.1)
Readers must note that Chapter 1 and Section 2.1 describe two independent approaches to
- create a grouped hyper data frame, from a data frame (Chapter 1, Listing 1.2, Section 17.1);
- create a grouped hyper data frame with one-and-only-one point-pattern hypercolumn, from a data frame (Section 2.1, Listing 2.1, Chapter 44).
These two approaches are independent and unrelated to each other (Section 56.1).
2.2 Batch Process on Eligible Marks
Listing 2.5 applies multiple batch processing functions to the eligible marks in each point-pattern of the one-and-only-one point-pattern hypercolumn s$ppp. in the grouped hyper data frame s (Listing 2.1) using a pipeline,
- the conditional mean \(E(r)\) of the numeric mark
hladrusing functionEmark_()(Table 35.22). The results are stored in the function-value-table (fv, Chapter 19) hypercolumn (Chapter 20)$hladr.Eof the output grouped hyper data frame; - the multi-type nearest-neighbor distance \(G_{\text{CK+.CD8- to CK-.CD8+}}(r)\) of the multi-type mark
phenotypeusing functionGcross_()(Table 35.24). The results are stored in the function-value-table hypercolumn$phenotype.Gof the output grouped hyper data frame; - the nearest neighbor distance from
CK+.CD8-toCK-.CD8+marks in the multi-type markphenotypeusing functionnncross_()(Table 35.25). The results are stored in the numeric-hypercolumn$phenotype.nncrossof the output grouped hyper data frame.
The functions Emark_(), Gcross_() and nncross_() in Listing 2.5 are independent of one another. Readers may apply one or both, in whichever order suits their workflow.
Listing 2.5 substitutes the recommended function values outside the recommended range with the corresponding theoretical values using function .disrecommend2theo() (Section 19.5.1). The function-value-table hypercolumns $hladr.E and $phenotype.G of the output are replaced with the substituted function-value-table hypercolumns.
r = seq.int(from = 0, to = 250, by = 10)
out = s |>
  Emark_(r = r, correction = 'none') |>
  Gcross_(i = 'CK+.CD8-', j = 'CK-.CD8+', r = r, correction = 'none') |>
  nncross_(i = 'CK+.CD8-', j = 'CK-.CD8+', correction = 'none') |>
  .disrecommend2theo()
out
# Grouped Hyper Data Frame: ~patient_id/image_id
#
# 15 image_id nested in
# 3 patient_id
#
#       OS gender age    patient_id          image_id  ppp. hladr.E phenotype.G phenotype.nncross
# 1  3488+      F  85 #01 0-889-121 [40864,18015].im3 (ppp)    (fv)        (fv)         (numeric)
# 2  3488+      F  85 #01 0-889-121 [42689,19214].im3 (ppp)    (fv)        (fv)         (numeric)
# 3  3488+      F  85 #01 0-889-121 [42806,16718].im3 (ppp)    (fv)        (fv)         (numeric)
# 4  3488+      F  85 #01 0-889-121 [44311,17766].im3 (ppp)    (fv)        (fv)         (numeric)
# ✂️ --- output truncated --- ✂️
2.3 Summarization
2.3.1 of Statistics of Point-Pattern Marks
Listing 2.6 summarizes various customized statistics of the numeric- and/or multi-type marks of the one-and-only-one point-pattern hypercolumn s$ppp. in the grouped hyper data frame s (Listing 2.1) using function aggregate_marks() (Section 25.7). The results are stored in the numeric-hypercolumn $markstats of the output (Listing 2.6, Listing 2.7). Note that Listing 2.6 does not require the function-value-table hypercolumns created by the batch processes (Listing 2.5).
s_markstat = s |>
  aggregate_marks(by = hladr ~ phenotype, FUN = \(z) {
    c(mean = mean(z), sd = sd(z))
  })
s_markstat
# Grouped Hyper Data Frame: ~patient_id/image_id
#
# 15 image_id nested in
# 3 patient_id
#
#       OS gender age    patient_id          image_id  ppp. markstats
# 1  3488+      F  85 #01 0-889-121 [40864,18015].im3 (ppp) (numeric)
# 2  3488+      F  85 #01 0-889-121 [42689,19214].im3 (ppp) (numeric)
# 3  3488+      F  85 #01 0-889-121 [42806,16718].im3 (ppp) (numeric)
# 4  3488+      F  85 #01 0-889-121 [44311,17766].im3 (ppp) (numeric)
# ✂️ --- output truncated --- ✂️s_markstat$markstats: summarizing customized statistics of point-pattern marks (Listing 2.6)
s_markstat$markstats
# 1:
# CK-.CD8-.hladr.mean   CK-.CD8-.hladr.sd CK+.CD8-.hladr.mean   CK+.CD8-.hladr.sd CK-.CD8+.hladr.mean   CK-.CD8+.hladr.sd
#          0.19611248          0.09574274          0.13157655          0.02220862          0.37042708          0.15887763
#
# 2:
# CK-.CD8-.hladr.mean   CK-.CD8-.hladr.sd CK+.CD8-.hladr.mean   CK+.CD8-.hladr.sd CK-.CD8+.hladr.mean   CK-.CD8+.hladr.sd
#          0.32685110          0.26761137          0.11682620          0.04559459          0.56401579          0.26288830
#
# ✂️ --- output truncated --- ✂️
2.3.2 of fv-Hypercolumns
Listing 2.8 summarizes the function-value-table (fv, Chapter 19) hypercolumns (Chapter 20) out$hladr.E and out$phenotype.G from the batch processes (Listing 2.5),
- by the recommended function values using function
keyval()(Section 19.2). The results are stored in the numeric-hypercolumns$hladr.E.yand$phenotype.G.yof the output grouped hyper data frame; - by the cumulative average vertical height of the trapezoidal integration of the recommended function values using function
cumvtrapz()(Section 10.2). The results are stored in the numeric-hypercolumns$hladr.E.cumvtrapzand$phenotype.G.cumvtrapzof the output grouped hyper data frame.
The functions keyval() and cumvtrapz() in Listing 2.8 are independent of one another. Readers may apply one or both, in whichever order suits their workflow.
out_fv = out |>
  keyval() |>
  cumvtrapz()
out_fv
# Grouped Hyper Data Frame: ~patient_id/image_id
#
# 15 image_id nested in
# 3 patient_id
#
#       OS gender age    patient_id          image_id  ppp. hladr.E phenotype.G phenotype.nncross hladr.E.y phenotype.G.y hladr.E.cumvtrapz phenotype.G.cumvtrapz
# 1  3488+      F  85 #01 0-889-121 [40864,18015].im3 (ppp)    (fv)        (fv)         (numeric) (numeric)     (numeric)         (numeric)             (numeric)
# 2  3488+      F  85 #01 0-889-121 [42689,19214].im3 (ppp)    (fv)        (fv)         (numeric) (numeric)     (numeric)         (numeric)             (numeric)
# 3  3488+      F  85 #01 0-889-121 [42806,16718].im3 (ppp)    (fv)        (fv)         (numeric) (numeric)     (numeric)         (numeric)             (numeric)
# 4  3488+      F  85 #01 0-889-121 [44311,17766].im3 (ppp)    (fv)        (fv)         (numeric) (numeric)     (numeric)         (numeric)             (numeric)
# ✂️ --- output truncated --- ✂️
2.3.3 of Quantiles
Listing 2.9 inspects the hypercolumns of the input grouped hyper data frame out (Listing 2.5) and finds the quantiles of,
- the numeric-hypercolumn
out$phenotype.nncross(Listing 2.5). The results are stored in the numeric-hypercolumn$phenotype.nncross.quantileof the output grouped hyper data frame; - the numeric mark
hladrin the one-and-only-one point-pattern hypercolumnout$ppp.(Section 2.1, Listing 2.1). The results are stored in the numeric-hypercolumn$hladr.quantileof the output grouped hyper data frame.
out_q = out |>
  quantile(probs = seq.int(from = 0, to = 1, by = .1))
out_q
# Grouped Hyper Data Frame: ~patient_id/image_id
#
# 15 image_id nested in
# 3 patient_id
#
#       OS gender age    patient_id          image_id  ppp. hladr.E phenotype.G phenotype.nncross phenotype.nncross.quantile hladr.quantile
# 1  3488+      F  85 #01 0-889-121 [40864,18015].im3 (ppp)    (fv)        (fv)         (numeric)                  (numeric)      (numeric)
# 2  3488+      F  85 #01 0-889-121 [42689,19214].im3 (ppp)    (fv)        (fv)         (numeric)                  (numeric)      (numeric)
# 3  3488+      F  85 #01 0-889-121 [42806,16718].im3 (ppp)    (fv)        (fv)         (numeric)                  (numeric)      (numeric)
# 4  3488+      F  85 #01 0-889-121 [44311,17766].im3 (ppp)    (fv)        (fv)         (numeric)                  (numeric)      (numeric)
# ✂️ --- output truncated --- ✂️
2.3.4 of Kernel Density Estimates
Listing 2.10 inspects the hypercolumns of the input grouped hyper data frame out (Listing 2.5) and finds the kernel density estimates of,
- the numeric-hypercolumn
out$phenotype.nncross(Listing 2.5). The results are stored in the numeric-hypercolumn$phenotype.nncross.kerndensof the output grouped hyper data frame; - the numeric mark
hladrin the one-and-only-one point-pattern hypercolumnout$ppp.(Section 2.1, Listing 2.1). The results are stored in the numeric-hypercolumn$hladr.kerndensof the output grouped hyper data frame.
mdist = out$phenotype.nncross |> unlist() |> max()
out_k = out |>
  kerndens(from = 0, to = mdist)
out_k
# Grouped Hyper Data Frame: ~patient_id/image_id
#
# 15 image_id nested in
# 3 patient_id
#
#       OS gender age    patient_id          image_id  ppp. hladr.E phenotype.G phenotype.nncross phenotype.nncross.kerndens hladr.kerndens
# 1  3488+      F  85 #01 0-889-121 [40864,18015].im3 (ppp)    (fv)        (fv)         (numeric)                  (numeric)      (numeric)
# 2  3488+      F  85 #01 0-889-121 [42689,19214].im3 (ppp)    (fv)        (fv)         (numeric)                  (numeric)      (numeric)
# 3  3488+      F  85 #01 0-889-121 [42806,16718].im3 (ppp)    (fv)        (fv)         (numeric)                  (numeric)      (numeric)
# 4  3488+      F  85 #01 0-889-121 [44311,17766].im3 (ppp)    (fv)        (fv)         (numeric)                  (numeric)      (numeric)
# ✂️ --- output truncated --- ✂️
2.4 Aggregation
Listing 2.11 aggregates (Section 25.6) the customized statistics s_markstat$markstats (Listing 2.7) of the numeric- and/or multi-type marks of the one-and-only-one point-pattern hypercolumn by patient_id using point-wise means pmeans() (Section 42.4), and returns a hyper data frame.
s_markstat |>
  aggregate(by = ~ patient_id, fun = pmean)
# Hyperframe:
#      OS gender age    patient_id markstats      ppp.
# 1 3488+      F  85 #01 0-889-121 (numeric) (ppplist)
# 2  1605      M  66 #02 1-037-393 (numeric) (ppplist)
# 3   176      M  84 #03 2-080-378 (numeric) (ppplist)
Listing 2.12 aggregates (Section 25.6) the summarized information from function-value-table hypercolumns (Listing 2.8) by patient_id using point-wise means pmeans() (Section 42.4), and returns a hyper data frame.
out_fv |>
  aggregate(by = ~ patient_id, fun = pmean)
# Hyperframe:
#      OS gender age    patient_id hladr.E.y phenotype.G.y hladr.E.cumvtrapz phenotype.G.cumvtrapz      ppp.  hladr.E phenotype.G
# 1 3488+      F  85 #01 0-889-121 (numeric)     (numeric)         (numeric)             (numeric) (ppplist) (fvlist)    (fvlist)
# 2  1605      M  66 #02 1-037-393 (numeric)     (numeric)         (numeric)             (numeric) (ppplist) (fvlist)    (fvlist)
# 3   176      M  84 #03 2-080-378 (numeric)     (numeric)         (numeric)             (numeric) (ppplist) (fvlist)    (fvlist)
Listing 2.13 aggregates (Section 25.6) the quantiles from the numeric-hypercolumns or the numeric marks of the one-and-only-one point-pattern hypercolumn (Listing 2.9) by patient_id using point-wise means pmeans() (Section 42.4), and returns a hyper data frame.
out_q |>
  aggregate(by = ~ patient_id)
# Hyperframe:
#      OS gender age    patient_id phenotype.nncross.quantile hladr.quantile      ppp.  hladr.E phenotype.G
# 1 3488+      F  85 #01 0-889-121                  (numeric)      (numeric) (ppplist) (fvlist)    (fvlist)
# 2  1605      M  66 #02 1-037-393                  (numeric)      (numeric) (ppplist) (fvlist)    (fvlist)
# 3   176      M  84 #03 2-080-378                  (numeric)      (numeric) (ppplist) (fvlist)    (fvlist)
Listing 2.14 aggregates (Section 25.6) the kernel density estimates from the numeric-hypercolumns or the numeric marks of the one-and-only-one point-pattern hypercolumn (Listing 2.10) by patient_id using point-wise means pmeans() (Section 42.4), and returns a hyper data frame.
out_k |>
  aggregate(by = ~ patient_id)
# Hyperframe:
#      OS gender age    patient_id phenotype.nncross.kerndens hladr.kerndens      ppp.  hladr.E phenotype.G
# 1 3488+      F  85 #01 0-889-121                  (numeric)      (numeric) (ppplist) (fvlist)    (fvlist)
# 2  1605      M  66 #02 1-037-393                  (numeric)      (numeric) (ppplist) (fvlist)    (fvlist)
# 3   176      M  84 #03 2-080-378                  (numeric)      (numeric) (ppplist) (fvlist)    (fvlist)