The function ppp() (v3.7.0.8) creates a two-dimensional point-pattern object (ppp.object), i.e., an R object of S3 class 'ppp'. A point-pattern contains the \(x\)- and \(y\)-coordinates in an observation window (owin, Chapter 33) and may contain
a numeric mark, e.g., longleaf (Section 9.17), etc.;
a multi-type mark, e.g., ants (Section 9.2), etc.;
more than one numeric and/or multi-type marks, e.g., betacells (Section 9.4), nbfires (Section 9.19), etc.
The S3 generic function as.ppp() (v3.7.0.8) converts R objects of various classes into a point-pattern. Listing 35.1 summarizes the S3 methods for the generic function as.ppp() in the spatstat.* family of packages,
The S3 methods na.omit.ppp() and na.exclude.ppp() omits and excludes, respectively, the missing marks from a point-pattern. Both functions return a point-pattern.
If missingness exists in the marks, the 'na.action'-attribute of the marks is saved as an attribute of the returned point-pattern.
Listing 35.3: Exception: functions na.omit.ppp() and na.exclude.ppp() on 'none' mark-format
Listing 35.7: Example: function is.numeric.ppp() on numeric mark
spatstat.data::longleaf |>is.numeric()# [1] TRUE
Listing 35.8: Example: function is.numeric.ppp() on multi-type mark
spatstat.data::ants |>is.numeric()# [1] FALSE
The S3 methods is.numeric.ppp() and is.multitype.ppp() (v3.7.0.8) behave differently for a point-pattern with 'dataframe' mark-format, e.g., betacells (Section 9.4).
Listing 35.9: Review: function is.multitype.ppp() on 'dataframe' mark-format
Listing 35.10: Example: functions is.numeric.ppp() on 'dataframe' mark-format
spatstat.data::betacells |>is.numeric()# type area # FALSE TRUE
35.3 Group-Generic of Numeric Mark(s)
35.3.1Math
Package groupedHyperframe (v0.3.4) implements the following S3 methods (Table 35.2) of the Math-groupGeneric,
Table 35.2: S3 methods of methods::Math (v4.5.2)
visible
isS4
Math.fvlist
TRUE
FALSE
Math.ppp
TRUE
FALSE
Math.ppplist
TRUE
FALSE
Math.psp
TRUE
FALSE
Math.tess
TRUE
FALSE
The S3 method Math.ppp() transforms one or more numeric marks of a point-pattern, and returns a point-pattern with the transformed marks. The \(x\)- and \(y\)-coordinates and the multi-type marks of the input point-pattern remain unchanged. This function, as well as the S3 method Math.tess() (Section 41.1.1), serves a similar purpose (Table 35.3) to the S3 methods Math.fv() (v3.7.0.12) and Math.im() (v3.7.0.8).
Listing 35.11 applies the log-transformations on the point-pattern bronzefilter (Section 9.5) with 'vector' mark-format.
Listing 35.11: Example: log-transformations on 'vector' mark-format
list(original = spatstat.data::bronzefilter,log = spatstat.data::bronzefilter |>log(),log1p = spatstat.data::bronzefilter |>log1p()) |>lapply(FUN = spatstat.geom::summary.ppp) |>lapply(FUN = getElement, name ='marks')# $original# Min. 1st Qu. Median Mean 3rd Qu. Max. # 0.013 0.120 0.160 0.167 0.200 0.467 # # $log# Min. 1st Qu. Median Mean 3rd Qu. Max. # -4.3428 -2.1203 -1.8326 -1.8989 -1.6094 -0.7614 # # $log1p# Min. 1st Qu. Median Mean 3rd Qu. Max. # 0.01292 0.11333 0.14842 0.15244 0.18232 0.38322
Listing 35.12 applies the log-transformation on the numeric marks in the point-pattern betacells (Section 9.4) with 'dataframe' mark-format.
Listing 35.12: Example: log-transformations on numeric marks in 'dataframe' mark-format
list(original = spatstat.data::betacells,log = spatstat.data::betacells |>log()) |>lapply(FUN = spatstat.geom::summary.ppp) |>lapply(FUN = getElement, name ='marks')# $original# type area # off:70 Min. :168.3 # on :65 1st Qu.:248.8 # Median :279.4 # Mean :291.2 # 3rd Qu.:324.2 # Max. :514.4 # # $log# type area # off:70 Min. :5.126 # on :65 1st Qu.:5.517 # Median :5.633 # Mean :5.653 # 3rd Qu.:5.782 # Max. :6.243
Listing 35.13 showcases the exception handling of the log-transformations on the \(x\)- and \(y\)-coordinates-only point-pattern vesicles (Section 9.24).
Listing 35.13: Exception: log-transformations on 'none' mark-format
Package groupedHyperframe (v0.3.4) implements the following S3 methods (Table 35.4) of the Summary-groupGeneric,
Table 35.4: S3 methods of methods::Summary (v4.5.2)
visible
isS4
Summary.fvlist
TRUE
FALSE
Summary.ppp
TRUE
FALSE
Summary.ppplist
TRUE
FALSE
Summary.psp
TRUE
FALSE
Summary.tess
TRUE
FALSE
The S3 method Summary.ppp() summarizes one or more numeric marks of a point-pattern. This function, as well as the S3 method Summary.tess() (Section 41.1.2), serves a similar purpose (Table 35.5) to the S3 methods Summary.fv() (v3.7.0.12) and Summary.im() (v3.7.0.8).
Listing 35.14 and Listing 35.15 find the minimum and the range of the numeric mark in the point-pattern bronzefilter (Section 9.5) with 'vector' mark-format.
Listing 35.14: Example: minimum of numeric marks on 'vector' mark-format
spatstat.data::bronzefilter |>min()# [1] 0.013
Listing 35.15: Example: range of numeric marks on 'vector' mark-format
35.4 Kernel Density (Estimates) of Numeric Mark(s)
The S3 generic function density_marks() finds the kernel densities (Becker, Chambers, and Wilks 1988) of the numeric mark(s). Package groupedHyperframe (v0.3.4) implements the following S3 methods (Table 35.6),
Table 35.6: S3 methods of groupedHyperframe::density_marks (v0.3.4)
visible
isS4
density_marks.ppp
TRUE
FALSE
density_marks.ppplist
TRUE
FALSE
The S3 method density_marks.ppp() finds the kernel densities of one or more numeric marks in a point-pattern. Table 35.7 shows the difference between the S3 methods density_marks.ppp() and density.ppp() (v3.7.0.12),
Table 35.7: Functions density_marks.ppp() versus density.ppp()
The S3 method kerndens.ppp() (Section 32.1, Table 32.2) finds the kernel density estimates of one or more numeric marks of a point-pattern; this is simply a wrapper of the S3 method density_marks.ppp().
Listing 35.29 and Listing 35.30 find the kernel density (estimates) of the two numeric marks diameter and height in the point-pattern finpines (Section 9.11).
Listing 35.29: Example: function density_marks.ppp() on two numeric marks in 'dataframe' mark-format
spatstat.data::finpines |>density_marks()# $diameter# # Call:# density.default(x = `$diameter`)# # Data: $diameter (126 obs.); Bandwidth 'bw' = 0.5106# # x y # Min. :-1.5318 Min. :0.0003457 # 1st Qu.: 0.9841 1st Qu.:0.0352813 # Median : 3.5000 Median :0.0574541 # Mean : 3.5000 Mean :0.0991600 # 3rd Qu.: 6.0159 3rd Qu.:0.1973683 # Max. : 8.5318 Max. :0.2662931 # # $height# # Call:# density.default(x = `$height`)# # Data: $height (126 obs.); Bandwidth 'bw' = 0.3912# # x y # Min. :-0.3736 Min. :0.0001153 # 1st Qu.: 1.3632 1st Qu.:0.0228185 # Median : 3.1000 Median :0.1429140 # Mean : 3.1000 Mean :0.1436587 # 3rd Qu.: 4.8368 3rd Qu.:0.2651729 # Max. : 6.5736 Max. :0.2887832
Listing 35.30: Example: function kerndens.ppp() on two numeric marks in 'dataframe' mark-format
Package groupedHyperframe (v0.3.4) implements the following S3 methods (Table 35.8) of the generic function quantile(),
Table 35.8: S3 methods of stats::quantile (v4.5.2)
visible
isS4
quantile.anylist
TRUE
FALSE
quantile.hyperframe
TRUE
FALSE
quantile.ppp
TRUE
FALSE
quantile.ppplist
TRUE
FALSE
The S3 method quantile.ppp() finds the quantiles of one or more numeric marks in a point-pattern. This is completely different from the S3 method SpatialQuantile.ppp() (v3.7.0.12).
Listing 35.32 showcases the exception handling for the \(x\)- and \(y\)-coordinates-only point-pattern vesicles (Section 9.24).
Listing 35.32: Exception: function quantile.ppp() on 'none' mark-format
spatstat.explore::Gcross# function (X, i, j, r = NULL, breaks = NULL, ..., rmax = NULL, # correction = c("rs", "km", "han")) # ✂️ --- output truncated --- ✂️
Listing 35.39: Review: user-interface of nncross()
spatstat.geom::nncross# function (X, Y, ...) # ✂️ --- output truncated --- ✂️
Listing 35.40 computes the distance to the nearest neighbour of points with 'Messor'-mark from each point with 'Cataglyphis'-mark in the point-pattern ants (Section 9.2) by using the functions split.ppp() and nncross.ppp()(v3.7.0.8).
nn = spatstat.data::ants |> spatstat.geom::split.ppp() |>with.default(expr = { spatstat.geom::nncross.ppp(X = Cataglyphis, Y = Messor, what ='dist') })
Listing 35.41 creates an identical return as Listing 35.40 using the function .nncross() with integer indices corresponding to the levels of the multi-type marks in ants (Section 9.2), i.e, 1L for 'Cataglyphis' and 2L for 'Messor'.
Listing 35.41: Example: function .nncross() with integerlevels indices
Listing 35.42 creates an identical return as Listing 35.40 using the function .nncross() with characterlevels of the multi-type marks in the point-pattern ants (Section 9.2).
Listing 35.42: Example: function .nncross() with characterlevels
Listing 35.43 showcases the exception handling when the character values supplied to the i and j parameters do not match any levels of the multi-type marks in the point-pattern ants (Section 9.2).
Listing 35.43: Exception: function .nncross(), non-existing levels
The S3 generic function aggregate_marks() aggregates various statistics (other than the quantiles, Section 35.5) of the marks within a point-pattern, or within each point-pattern of an object containing one or more point-patterns. Package groupedHyperframe (v0.3.4) implements the following S3 methods (Table 35.9),
Table 35.9: S3 methods of groupedHyperframe::aggregate_marks (v0.3.4)
visible
isS4
aggregate_marks.hyperframe
TRUE
FALSE
aggregate_marks.ppp
TRUE
FALSE
aggregate_marks.ppplist
TRUE
FALSE
The S3 method aggregate_marks.ppp() aggregates a set of fully customizable summary statistics, in the parameter FUN or expr, of the marks within a point-pattern. For each type of the mark-format of the input point-pattern,
markformat = 'none' (Section 35.7.1): returns an invisibleNULL-value.
markformat = 'vector' (Section 35.7.2): computes the summary statistics of the numeric- or multi-type marks.
markformat = 'dataframe' (Section 35.7.3): aggregates the numeric- and/or multi-type marks, according to a grouping structure determined by one-or-more multi-type-marks in the parameter by (Section 35.7.3.1), using the workhorse function aggregate.data.frame().
The returned aggregated summary statistics can be vectorized for downstream use (Section 36.4).
Table 35.10 explains how the S3 method aggregate_marks.ppp() generalizes the aggregation-of-marks, compared to the S3 method summary.ppp() (v3.7.0.8).
Table 35.10: Functions aggregate_marks.ppp() versus summary.ppp()
Listing 35.47, Listing 35.48 and Listing 35.49 aggregate the sample mean, or both the sample mean and the sample standard deviation, or the common summary statistics, of the numeric mark in the point-pattern spruces (Section 9.21). The parameter z in Listing 35.48 represents the numeric mark as a vector, and may be replaced by any other symbol of the user’s choice.
Listing 35.47: Example: sample mean
spatstat.data::spruces |>aggregate_marks(FUN = mean)# mean # 0.2503731
Listing 35.50: Review: function summary.ppp(), numeric mark in 'vector' mark-format
spatstat.data::spruces |> spatstat.geom::summary.ppp() |>getElement(name ='marks')# Min. 1st Qu. Median Mean 3rd Qu. Max. # 0.1600 0.2200 0.2450 0.2504 0.2700 0.3700
Listing 35.51 and Listing 35.52 aggregate the (relative) frequencies of the multi-type mark in the point-pattern ants (Section 9.2). The parameter z in Listing 35.52 represents the multi-type mark as a vector, and may be replaced by any other symbol of the user’s choice.
Listing 35.51: Example: frequencies
spatstat.data::ants |>aggregate_marks(FUN = table)# Cataglyphis Messor # 29 68
Listing 35.52: Example: relative frequencies
spatstat.data::ants |>aggregate_marks(FUN = \(z) table(z)/length(z))# Cataglyphis Messor # 0.2989691 0.7010309
Listing 35.53: Review: function summary.ppp(), multi-type mark in 'vector' mark-format
spatstat.data::ants |> spatstat.geom::summary.ppp() |>getElement(name ='marks')# frequency proportion intensity# Cataglyphis 29 0.2989691 6.761144e-05# Messor 68 0.7010309 1.585372e-04
35.7.3'dataframe' mark-format
Listing 35.54 aggregates the numeric mark area and multi-type mark type in the point-pattern betacells (Section 9.4) using the statistics specified as R language in the parameter expr.
Listing 35.54: Example: numeric- and multi-type mark in 'dataframe' mark-format
spatstat.data::betacells |>aggregate_marks(expr =list(type =table(type),area =summary.default(area) ))# $type# type# off on # 70 65 # # $area# Min. 1st Qu. Median Mean 3rd Qu. Max. # 168.3 248.8 279.4 291.2 324.2 514.4
Listing 35.56: Review: function summary.ppp(), numeric and multi-type mark in 'dataframe' mark-format
spatstat.data::betacells |> spatstat.geom::summary.ppp() |>getElement(name ='marks')# type area # off:70 Min. :168.3 # on :65 1st Qu.:248.8 # Median :279.4 # Mean :291.2 # 3rd Qu.:324.2 # Max. :514.4
35.7.3.1 Use of Parameter by
The S3 method aggregate_marks.ppp() accepts a two-sided formula for the parameter by, if the input point-pattern has 'dataframe' mark-format. The left-hand-side of the formula by contains the name(s) of one or more mark(s) to be summarized, e.g.,
The right-hand-side of the formula by contains the name(s) of one or more multi-type mark(s) to indicate the grouping structure of the aggregation, e.g.,
Note that the S3 method summary.ppp() (v3.7.0.8) does not provide summary statistics by-group (Listing 35.56).
35.7.3.1.1 Aggregate by One Group
Listing 35.57 and Listing 35.58 aggregate the numeric mark area by the multi-type mark type of the point-pattern betacells (Section 9.4), using the sample mean, or both the sample mean and the sample standard deviation. The parameter z in Listing 35.58 represents the numeric mark area in the left-hand-side of the formula by, and may be replaced by any other symbol of the user’s choice.
Listing 35.57: Example: sample mean of area-by-type
spatstat.data::betacells |>aggregate_marks(by = area ~ type, FUN = mean)# type area# 1 off 259.7214# 2 on 325.1169
Listing 35.58: Example: sample mean and sd of area-by-type
spatstat.data::betacells |>aggregate_marks(by = area ~ type, FUN = \(z) {c(mean =mean(z), sd =sd(z)) })# type area.mean area.sd# 1 off 259.72143 40.86083# 2 on 325.11692 60.71534
Listing 35.61 and Listing 35.62 aggregate one multi-type mark season by another multi-type mark group of the point-pattern gorillas (Section 9.13), using the (relative) frequencies. The parameter z in Listing 35.62 represents the multi-type mark season in the left-hand-side of the formula by, and may be replaced by any other symbol of the user’s choice.
Listing 35.61: Example: frequencies of season-by-group
spatstat.data::gorillas |>aggregate_marks(by = season ~ group, FUN = table)# group season.dry season.rainy# 1 major 150 200# 2 minor 125 172
Listing 35.62: Example: relative frequencies of season-by-group
spatstat.data::gorillas |>aggregate_marks(by = season ~ group, FUN = \(z) table(z)/length(z))# group season.dry season.rainy# 1 major 0.4285714 0.5714286# 2 minor 0.4208754 0.5791246
appending a numeric mark hr.last (Section 35.9), the time difference in hours between the put-out out.date and the discovery dis.date, to the existing marks;
selecting a subset of points that represent 'forest' and/or 'grass' fires caused by railroads 'rrds' and/or recreation 'rec';
removing the points with any missing marks (Section 35.1);
performing log1p-transformations on the numeric marks (Section 35.3.1) fnl.size and hr.last.
Listing 35.66 aggregates the log1p-transformed numeric mark fnl.size by the interaction of two multi-type marks fire.type and cause in the point-pattern nbfL (Listing 35.65), using the sample mean and the sample standard deviation sd. The parameter z in Listing 35.66 represents the log1p-transformed numeric mark fnl.size in the left-hand-side of the formula by, and may be replaced by any other symbol of the user’s choice.
Listing 35.66: Example: sample mean and sd of log1p-transformed fnl.size-by-fire.type:cause (Listing 35.65)
Listing 35.67 aggregates the log1p-transformed numeric marks fnl.size and hr.last by the interaction of two multi-type marks fire.type and cause in the point-pattern nbfL (Listing 35.65), using the sample mean and the sample standard deviation sd. The parameter z in Listing 35.67 represents the log1p-transformed numeric marks fnl.size and hr.last, respectively, in the left-hand-side of the formula by, and may be replaced by any other symbol of the user’s choice. Note that the use of cbind() in the formula by follows that of the S3 method aggregate.data.frame().
Listing 35.67: Example: sample mean and sd of log1p-transformed fnl.size-and-hr.last-by-fire.type:cause (Listing 35.65)
The design of the S3 class 'ppp' specifies that if the marks are a data frame with only 1 column, then the marks will be converted to a vector.
This design choice was made a long time ago, in order to avoid problems that would otherwise occur in the rest of the spatstat code.
If we were to retrospectively change the specification, we would have a lot of work to do in the rest of the code, and the documentation.
On the other hand, function grouped_ppp() (Chapter 2, Chapter 44) relies on the support of ncol-1L'dataframe'-marks. As an ad hoc solution, the author defines
an (internal) derived class 'ppp_tzh' (initials of T. Zhan) that inherits from the S3 class 'ppp', and
an S3 method `[.ppp_tzh` that respects the ncol-1L'dataframe'-marks. The S3 method `[.ppp_tzh` is a teeny-tiny modification of the S3 method spatstat.geom::`[.ppp`. Permision from Dr. Baddeley? GPL-2?
Listing 35.70 retains the name of the mark hladr as the column name of the ncol-1L'dataframe'-marks (Listing 35.71), for downstream analysis.
Listing 35.70: Example: function grouped_ppp() with one mark
s_a = wrobel_lung |>grouped_ppp(formula = hladr ~ OS + gender + age | patient_id/image_id)
Listing 35.71: Example: support of ncol-1L'dataframe' mark-format, name of mark retained
The S3 generic syntactic sugar `append_marks<-` appends additional mark(s) to the existing marks. Package groupedHyperframe (v0.3.4) implements the following S3 methods (Table 35.11),
Table 35.11: S3 methods of groupedHyperframe::`append_marks<-` (v0.3.4)
visible
isS4
append_marks<-.ppp
TRUE
FALSE
append_marks<-.psp
TRUE
FALSE
append_marks<-.tess
TRUE
FALSE
The S3 method `append_marks<-.ppp` appends additional mark(s) to (the existing marks of) a point-pattern. Table 35.12 summarizes the differences of the S3 methods `append_marks<-.ppp` versus `marks<-.ppp` (v3.7.0.8).
Table 35.12: Functions `append_marks<-.ppp` versus `marks<-.ppp`
Listing 35.72: Example: function `append_marks<-.ppp`, no existing marks
ves = spatstat.data::vesiclesset.seed(12); append_marks(ves) =quote(rlnorm(n = .))ves# Marked planar point pattern: 37 points# marks are numeric, of storage type 'double'# window: polygonal boundary# enclosing rectangle: [22.6796, 586.2292] x [11.9756, 1030.7] nm
Listing 35.73: Review: function `marks<-.ppp`, no existing marks
Code
suppressPackageStartupMessages(library(spatstat.geom)) # to put function spatstat.geom::`marks<-.ppp` on search pathves. = spatstat.data::vesiclesset.seed(12); marks(ves.) =rlnorm(n =npoints.ppp(ves.))stopifnot(identical(ves, ves.))
Listing 35.76: Example: function `append_marks<-.ppp`, existing multi-type marks
ant = spatstat.data::antsset.seed(42); append_marks(ant) =quote(rlnorm(n = .))ant# Marked planar point pattern: 97 points# Mark variables: m1, m2 # window: polygonal boundary# enclosing rectangle: [-25, 803] x [-49, 717] units (one unit = 0.5 feet)
Listing 35.77 appends a random log-normal mark to the three existing marks of the point-pattern gorillas (Section 9.13). The new mark is automatically named m4.
Listing 35.77: Example: function `append_marks<-.ppp`, existing 'dataframe' marks
Listing 35.78 appends two random log-normal marks, with user-specified mark names, to the three existing marks of the point-pattern gorillas (Section 9.13).
Listing 35.78: Example: function `append_marks<-.ppp`, existing 'dataframe' marks, multiple new marks
The S3 generic function .rmax() provides the default \(r_\text{max}\) used in functions from package spatstat.explore (v3.7.0.12) that return a function-value-table (fv.object, Chapter 19), i.e., the workhorse functions in Table 35.22 and Table 35.24. Package groupedHyperframe (v0.3.4) implements the following S3 methods (Table 35.13),
Table 35.13: S3 methods of groupedHyperframe::.rmax (v0.3.4)
visible
isS4
.rmax.fv
TRUE
FALSE
.rmax.hyperframe
TRUE
FALSE
.rmax.ppp
TRUE
FALSE
.rmax.ppplist
TRUE
FALSE
The S3 method .rmax.ppp() finds the default \(r_\text{max}\) used by various functions applicable to a point-pattern and returning a function-value-table. It is
Table 35.14: an off-label use of functions spatstat.explore::rmax.rule() and spatstat.geom::handle.r.b.args()
Table 35.14: Default \(r_\text{max}\) used in functions from package spatstat.explore (v3.7.0.12) that return an fv.object
The function kmeans.ppp() performs \(k\)-means clustering (Hartigan and Wong 1979) on a point-pattern. This is a “pseudo” S3 method, as the workhorse function kmeans() (R version 4.5.2 (2025-10-31)) is not an S3 generic function. Note that to reproduce a kmeans() clustering, readers must set the .Random.seed beforehand.
The function kmeans.ppp() has parameters
formula, \(x\)- and/or \(y\)- coordinate(s) and/or (one or more of the) numeric marks
(optional) centers, number of clusters
(optional) clusterSize, “expected” number of points per cluster.
User should specify one of the two optional parameters centers and clusterSize. If both are specified, then parameter clusterSize takes priority and parameter centers is ignored.
The function kmeans.ppp() returns an object of S3 class 'pppkm', which inherits from the class 'ppp' and is assigned with additional attributes,
attr(.,'f'), a factor indicating the \(k\)-means clustering indices.
Package groupedHyperframe (v0.3.4) implements the following S3 methods to the class 'pppkm' (Table 35.15), most of which are straightforward extensions of the S3 methods for the class 'ppp' (Listing 35.2).
Listing 35.82 performs 3L-means clustering on the \(x\)- and \(y\)-coordinates-only point-pattern vesicles (Section 9.24) by the \(x\)-coordinates.
Listing 35.82: Example: function kmeans.ppp(); cluster vesicles by ~ x
set.seed(12); spatstat.data::vesicles |>kmeans.ppp(formula =~ x, centers =3L)# Planar point pattern: 37 points# window: polygonal boundary# enclosing rectangle: [22.6796, 586.2292] x [11.9756, 1030.7] nm# with k-means clustering of 10, 15, 12 points
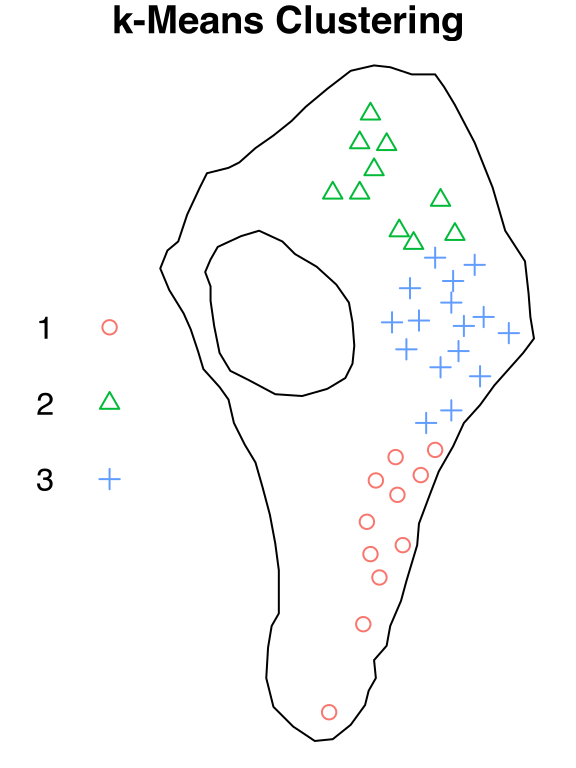
Listing 35.83 performs 3L-means clustering on vesicles (Section 9.24) by the \(x\)- and \(y\)-coordinates. Figure 35.1 visualizes the \(x\)- and \(y\)-coordinates and the 3L-means clustering indices.
Listing 35.83: Example: function kmeans.ppp(); cluster vesicles by ~ x + y
set.seed(21); vesicles_k2 = spatstat.data::vesicles |>kmeans.ppp(formula =~ x + y, centers =3L)vesicles_k2# Planar point pattern: 37 points# window: polygonal boundary# enclosing rectangle: [22.6796, 586.2292] x [11.9756, 1030.7] nm# with k-means clustering of 11, 10, 16 points
Listing 35.84: Figure: function plot.pppkm(); cluster vesicles by ~ x + y
Code
par(mar =c(0,0,1,0))vesicles_k2 |>plot()
Figure 35.1: Cluster vesicles by ~ x + y
Listing 35.85 performs \(k\)-means clustering on vesicles (Section 9.24) by the \(x\)- and \(y\)-coordinates, with an expected cluster size of 10L.
Listing 35.85: Example: function kmeans.ppp(); cluster vesicles by ~ x + y and parameter clusterSize
set.seed(43); spatstat.data::vesicles |>kmeans.ppp(formula =~ x + y, clusterSize =10L)# Planar point pattern: 37 points# window: polygonal boundary# enclosing rectangle: [22.6796, 586.2292] x [11.9756, 1030.7] nm# with k-means clustering of 9, 10, 12, 6 points
Listing 35.86: Example: function kmeans.ppp(); cluster spruces by ~ x + marks
set.seed(30); spatstat.data::spruces |>kmeans.ppp(formula =~ x + marks, centers =3L)# Marked planar point pattern: 134 points# marks are numeric, of storage type 'double'# window: rectangle = [0, 56] x [0, 38] metres# with k-means clustering of 47, 39, 48 points
Listing 35.87: Example: function kmeans.ppp(); cluster spruces by ~ x + y + marks
set.seed(62); spatstat.data::spruces |>kmeans.ppp(formula =~ x + y + marks, centers =3L)# Marked planar point pattern: 134 points# marks are numeric, of storage type 'double'# window: rectangle = [0, 56] x [0, 38] metres# with k-means clustering of 40, 38, 56 points
Listing 35.88: Example: function kmeans.ppp(); cluster finpines by ~ x + y + height
set.seed(18); spatstat.data::finpines |>kmeans.ppp(formula =~ x + y + height, centers =3L)# Marked planar point pattern: 126 points# Mark variables: diameter, height # window: rectangle = [-5, 5] x [-8, 2] metres# with k-means clustering of 38, 42, 46 points
Listing 35.89: Example: function kmeans.ppp(); cluster finpines by ~ x + diameter + height
set.seed(20); spatstat.data::finpines |>kmeans.ppp(formula =~ x + diameter + height, centers =3L)# Marked planar point pattern: 126 points# Mark variables: diameter, height # window: rectangle = [-5, 5] x [-8, 2] metres# with k-means clustering of 37, 45, 44 points
35.11.2 Split by \(k\)-Means Clustering
Package groupedHyperframe (v0.3.4) implements the following S3 methods of the generic function split() (R version 4.5.2 (2025-10-31)) (Table 35.16),
Table 35.16: S3 methods of base::split (v4.5.2)
visible
isS4
split.hyperframekm
TRUE
FALSE
split.pppkm
TRUE
FALSE
split.pppkmlist
TRUE
FALSE
The S3 method split.pppkm() (Listing 35.90) splits the \(k\)-means clustered point-pattern flu$pattern[[1L]] (Section 9.12) by its \(k\)-means clustering indices.
Listing 35.90: Example: function split.pppkm()
Code
set.seed(15); spatstat.data::flu$pattern[[1L]] |>kmeans.ppp(formula =~ x + y, centers =3L) |>split()# Point pattern split by factor # # 1:# Marked planar point pattern: 169 points# Multitype, with levels = M2, M1 # window: rectangle = [0, 3331] x [0, 3331] nm# # 2:# Marked planar point pattern: 157 points# Multitype, with levels = M2, M1 # window: rectangle = [0, 3331] x [0, 3331] nm# # 3:# Marked planar point pattern: 145 points# Multitype, with levels = M2, M1 # window: rectangle = [0, 3331] x [0, 3331] nm
Table 35.17: S3 methods of groupedHyperframe::pairwise_cor_spatial (v0.3.4)
visible
isS4
pairwise_cor_spatial.ppp
TRUE
FALSE
pairwise_cor_spatial.ppplist
TRUE
FALSE
The S3 method pairwise_cor_spatial.ppp() finds the nonparametric Tjøstheim (1978)’s correlation coefficients from the pairwise-combinations of all numeric marks in a point-pattern, and returns an object of S3 class 'pairwise_cor_spatial', which inherits from the class 'dist' defined in package stats (R version 4.5.2 (2025-10-31)). Such inheritance, as well as the intrinsic similarity in data structure (Table 35.18), enables us to make use of the S3 methods to class 'dist', e.g., stats:::print.dist(), stats:::as.matrix.dist(), stats:::format.dist() and stats:::labels.dist(). Package groupedHyperframe (v0.3.4) implements the following S3 methods to the class 'pairwise_cor_spatial' (Table 35.19),
Table 35.18: Similarity in Data Structure, 'pairwise_cor_spatial' & 'dist'
The S3 method as.matrix.pairwise_cor_spatial() returns a matrix of pairwise Tjøstheim (1978)’s coefficients with diagonal values of 1. This matrix, however, is not a correlation matrix, because Tjøstheim (1978)’s correlation coefficient
is nonparametric, i.e., there is no definition of the corresponding covariance, standard deviation sd, nor the conversion cov2cor method;
does not provide a mathematical mechanism to ensure that this matrix is positive definite.
Listing 35.94 performs the random re-labelling envelope residual and test on the point-pattern anemones (Section 9.1).
Listing 35.94: Example: function rlabelRes.ppp(), with Kmark
set.seed(52); spatstat.data::anemones |>rlabelRes(fun = spatstat.explore::Kmark) |> GET::global_envelope_test()# Global envelope test (1d):# * Based on the measure: "erl"# * 95% global envelope# * p-value of the global test: 0.01# * Significance level of the global test: 0.05# * Number of r with observed function outside the envelope: 443# * Total number of argument values r : 513# The object contains: # $r - Argument values : num [1:513] 0 0.0879 0.1758 0.2637 0.3516 ...# $obs - Observed function : num [1:513] 0 0 0 0 0 0 0 0 0 0 ...# $central - Central function : num [1:513] 0 0 0 0 0 0 0 0 0 0 ...# $lo - Lower boundary of the global envelope: num [1:513] 0 0 0 0 0 0 0 0 0 0 ...# $hi - Upper boundary of the global envelope: num [1:513] 0 0 0 0 0 0 0 0 0 0 ...
Listing 35.95 performs the random re-labelling envelope residual and test on the point-pattern anemones (Section 9.1).
Listing 35.95: Example: function rlabelRes.ppp(), with Kmark and f = `*`
set.seed(52); spatstat.data::anemones |>rlabelRes(fun = spatstat.explore::Kmark, f =`*`) |> GET::global_envelope_test()# Global envelope test (1d):# * Based on the measure: "erl"# * 95% global envelope# * p-value of the global test: 0.01# * Significance level of the global test: 0.05# * Number of r with observed function outside the envelope: 443# * Total number of argument values r : 513# The object contains: # $r - Argument values : num [1:513] 0 0.0879 0.1758 0.2637 0.3516 ...# $obs - Observed function : num [1:513] 0 0 0 0 0 0 0 0 0 0 ...# $central - Central function : num [1:513] 0 0 0 0 0 0 0 0 0 0 ...# $lo - Lower boundary of the global envelope: num [1:513] 0 0 0 0 0 0 0 0 0 0 ...# $hi - Upper boundary of the global envelope: num [1:513] 0 0 0 0 0 0 0 0 0 0 ...
Listing 35.96 performs the random re-labelling envelope residual and test on the point-pattern ant (Section 9.2).
Listing 35.96: Example: function rlabelRes.ppp(), with Gcross
set.seed(12); spatstat.data::ants |>rlabelRes(fun = spatstat.explore::Gcross) |> GET::global_envelope_test()# Global envelope test (1d):# * Based on the measure: "erl"# * 95% global envelope# * p-value of the global test: 0.02# * Significance level of the global test: 0.05# * Number of r with observed function outside the envelope: 95# * Total number of argument values r : 513# The object contains: # $r - Argument values : num [1:513] 0 0.297 0.594 0.891 1.188 ...# $obs - Observed function : num [1:513] 0 0 0 0 0 0 0 0 0 0 ...# $central - Central function : num [1:513] 0 0 0 0 0 0 0 0 0 0 ...# $lo - Lower boundary of the global envelope: num [1:513] 0 0 0 0 0 0 0 0 0 0 ...# $hi - Upper boundary of the global envelope: num [1:513] 0 0 0 0 0 0 0 0 0 0 ...
The random re-labelling envelope residual and test require calling the S3 generic function rlabelRes()and
instead of having one single “combined” function, due to the difficulty of manipulating the formal arguments of functions envelope.ppp() (v3.7.0.12) and global_envelope_test() (v1.0.7). Specifically (Listing 35.97),
it’s almost impossible to determine whether some parameter(s) should be sent to the dynamic-dots ... of function envelope.ppp() or global_envelope_test().
Table 35.22, Table 35.24 and Table 35.25 delve into the intricate mechanics of the batch processes (Section 2.2), offering insights that will resonate with advanced R practitioners. Package groupedHyperframe (v0.3.4) implements the following S3 methods (Table 35.21),
Listing 35.99 finds the conditional mean \(E(r)\) of the eligible numeric mark area in the point-pattern betacells (Section 9.4).
Listing 35.99: Example: function Emark_.ppp()
spatstat.data::betacells |>Emark_()# An 'fvlist' of 1 fv.objects E(r) # Name(s): area # Available rmax: 187.5 # Minimum Legal rmax: 187.5
Listing 35.100 shows that a generic name m is used for the 'vector' mark-format of the point-pattern spruces (Section 9.21).
Listing 35.100: Example: function Emark_.ppp(), 'vector' mark-format
spatstat.data::spruces |>Emark_()# An 'fvlist' of 1 fv.objects E(r) # Name(s): m # Available rmax: 9.5 # Minimum Legal rmax: 9.5
A similar batch mechanism exists in package spatstat.explore (v3.7.0.12) for ppp.object with 'dataframe' mark-format. Table 35.23 shows the difference and connection between the batch mechanism in Table 35.22 versus that in package spatstat.explore. Listing 35.101 - Listing 35.103 illustrate them using a point-pattern finpines (Section 9.11) with two numeric marks.
Table 35.23: Batch mechanism for point-patterns with 'dataframe' mark-format
Listing 35.104 finds the multi-type nearest-neighbor distance \(G_{ij}(r)\) from the marks 'off' to 'on' in the eligible multi-type mark type in the point-pattern betacells (Section 9.4).
Listing 35.104: Example: function Gcross_.ppp(., i = 'off', j = 'on')
spatstat.data::betacells |>Gcross_(i ='off', j ='on')# An 'fvlist' of 1 fv.objects G[off,on](r) # Name(s): type # Available rmax: 204.686521588743 # Minimum Legal rmax: 204.7
35.14.3 Distance from Multi-Type Mark(s)
The S3 methods in Table 35.25 are user-friendly wrappers of the low-level utility function ppp2dist(). These S3 methods
identify all eligible multi-type marks in the input point-pattern;
apply the workhorse function per multi-type mark;
return a numeric vector-list (vectorlist, Chapter 42), named by the multi-type mark(s).
Table 35.25: Batch processes; eligible multi-type marks to numeric-vectors
Listing 35.105 applies the function .nncross() (Section 35.6) to the multi-type mark type in the point-pattern betacells (Section 9.4), which contains (at least) the two levels of 'off' and 'on'.
Listing 35.105: Example: function nncross_.ppp(., i = 'off', j = 'on')
spatstat.data::betacells |>nncross_(i ='off', j ='on')# A 'vectorlist' of 1 vectors # Name(s): type # Storage Mode: numeric # Individual Vector Length: 70 # Suffix: nncross
Listing 35.106 applies the function .nncross() (Section 35.6) to the multi-type mark group in the point-pattern gorillas (Section 9.13), which contains (at least) the two levels of 'major' and 'minor'.
Listing 35.106: Example: function nncross_.ppp(., i = 'major', j = 'minor')
spatstat.data::gorillas |>nncross_(i ='major', j ='minor')# A 'vectorlist' of 1 vectors # Name(s): group # Storage Mode: numeric # Individual Vector Length: 350 # Suffix: nncross
Listing 35.107 applies the function .nncross() (Section 35.6) to the multi-type mark season in the point-pattern gorillas (Section 9.13), which contains (at least) the two levels of 'rainy' and 'dry'.
Listing 35.107: Example: function nncross_.ppp(., i = 'rainy', j = 'dry')
spatstat.data::gorillas |>nncross_(i ='rainy', j ='dry')# A 'vectorlist' of 1 vectors # Name(s): season # Storage Mode: numeric # Individual Vector Length: 372 # Suffix: nncross
Listing 35.108 showcases the exception handling when no eligible multi-type mark exists in the point-pattern gorillas (Section 9.13) that contains both levels 'alpha' and 'beta'.
Listing 35.108: Exception: function nncross_.ppp(., i = 'male', j = 'female')
Baddeley, Adrian, Peter J. Diggle, Andrew Hardegen, Thomas Lawrence, Robin K. Milne, and Gopalan Nair. 2014. “On Tests of Spatial Pattern Based on Simulation Envelopes.”Ecological Monographs 84 (3): 477–89. https://doi.org/10.1890/13-2042.1.
Baddeley, Adrian, and Rolf Turner. 2005. “spatstat: An R Package for Analyzing Spatial Point Patterns.”Journal of Statistical Software 12 (6): 1–42. https://doi.org/10.18637/jss.v012.i06.
Becker, Richard A., John M. Chambers, and Allan R. Wilks. 1988. The New S Language. 1st ed. Boca Raton, FL: Chapman; Hall/CRC. https://doi.org/10.1201/9781351074988.
Diggle, Peter. 1985. “A Kernel Method for Smoothing Point Process Data.”Journal of the Royal Statistical Society: Series C 34 (2): 138–47. https://doi.org/10.2307/2347366.
Hartigan, John A., and M. A. Wong. 1979. “A \(K\)-Means Clustering Algorithm.”Journal of the Royal Statistical Society: Series C (Applied Statistics) 28 (1): 100–108. https://doi.org/10.2307/2346830.
Hubert, Lawrence J., and Reginald G. Golledge. 1982. “Measuring Association Between Spatially Defined Variables: Tjøstheim’s Index and Some Extensions.”Geographical Analysis 14 (3): 273–78. https://doi.org/10.1111/j.1538-4632.1982.tb00077.x.
Myllymäki, Mari, and Tomáš Mrkvička. 2024. “GET: Global Envelopes in R.”Journal of Statistical Software 111 (3): 1–40. https://doi.org/10.18637/jss.v111.i03.
Myllymäki, Mari, Tomáš Mrkvička, Pavel Grabarnik, Henri Seijo, and Ute Hahn. 2016. “Global Envelope Tests for Spatial Processes.”Journal of the Royal Statistical Society Series B: Statistical Methodology 79 (2): 381–404. https://doi.org/10.1111/rssb.12172.
Penttinen, Antti, Dietrich Stoyan, and Helena M. Henttonen. 1992. “Marked Point Processes in Forest Statistics.”Forest Science 38 (4): 806–24. https://doi.org/10.1093/forestscience/38.4.806.
Schlather, Martin, Jr Ribeiro Paulo J., and Peter J. Diggle. 2003. “Detecting Dependence Between Marks and Locations of Marked Point Processes.”Journal of the Royal Statistical Society Series B: Statistical Methodology 66 (1): 79–93. https://doi.org/10.1046/j.1369-7412.2003.05343.x.
Vallejos, R., F. Osorio, and M. Bevilacqua. 2020. Spatial Relationships Between Two Georeferenced Variables: With Applications in R. New York: Springer. http://srb2gv.mat.utfsm.cl/.
Van Lieshout, M. N. M., and A. J. Baddeley. 1999. “Indices of Dependence Between Types in Multivariate Point Patterns.”Scandinavian Journal of Statistics 26 (4): 511–32. https://doi.org/10.1111/1467-9469.00165.
Wälder, Olga, and Dietrich Stoyan. 1996. “On Variograms in Point Process Statistics.”Biometrical Journal 38 (8): 895–905. https://doi.org/10.1002/bimj.4710380802.