The function solist() (v3.7.0.8) creates an R object of S3 class 'ppplist', if all of the input objects are two-dimensional point-patterns (ppp.object, Chapter 35). The S3 class 'ppplist' inherits from the classes 'solist' (Chapter 38), 'anylist' (Chapter 14), 'listof' and 'list'. Listing 36.1 summarizes the S3 methods for the class 'ppplist' in the spatstat.* family of packages,
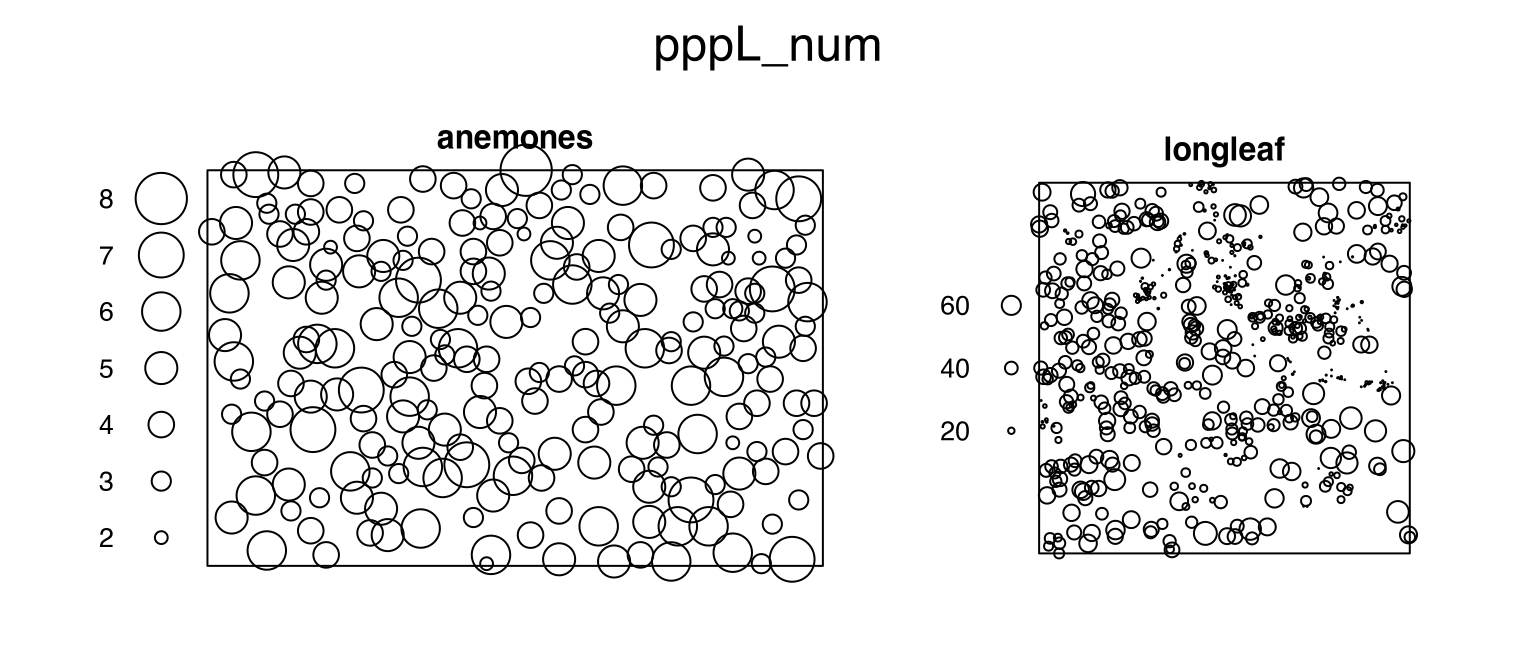
Listing 36.2 creates a point-pattern-list pppL_num that contains the point-patterns anemones (Section 9.1) and longleaf (Section 9.17), both with one numeric mark.
Listing 36.2: Data: a point-pattern-list with one numeric mark
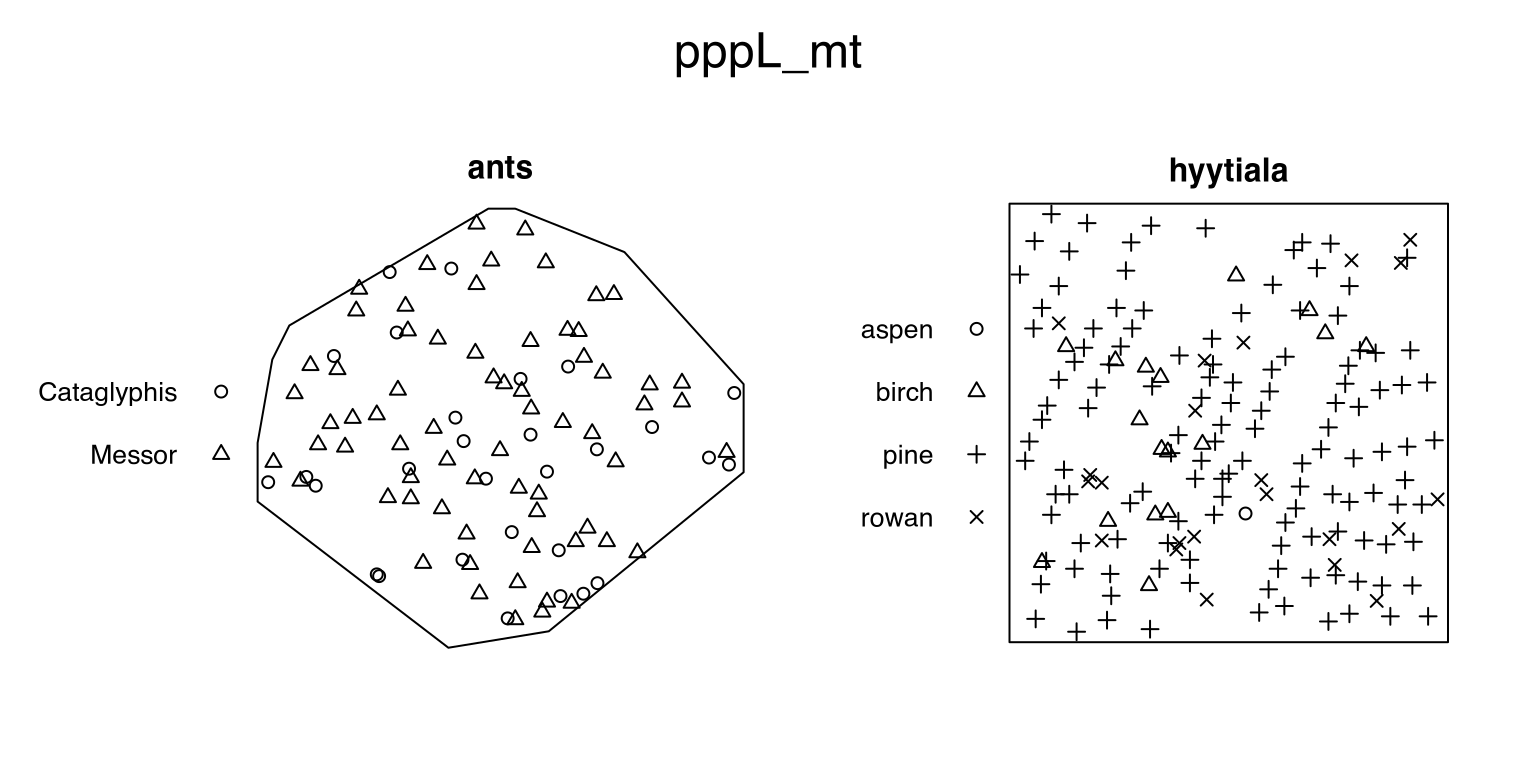
Listing 36.4 creates a point-pattern-list pppL_mt that contains the point-patterns ants (Section 9.2) and hyytiala (Section 9.15), both with one multi-type mark.
Listing 36.4: Data: a point-pattern-list with one multi-type mark
The S3 method density_marks.ppplist() (Section 35.4, Table 35.6) applies the S3 method density_marks.ppp() (Section 35.4) to each point-pattern in the input point-pattern-list.
The S3 method kerndens.ppplist() (Section 32.1, Table 32.2) applies the S3 method kerndens.ppp() (Section 35.4) to each point-pattern in the input point-pattern-list.
As explained in Section 35.4, Table 35.7, the S3 method density_marks.ppplist() is different from the S3 method density.ppplist() (v3.7.0.12), which uses the \(x\)- and \(y\)-coords only thus provides an identical return with the marks removed from the input point-pattern-list (Listing 36.11).
aggregates and vectorizes the marks of each point-pattern in the input point-pattern-list using the S3 method aggregate_marks.ppp() (Section 35.7);
returns a numeric list or vectorlist (Chapter 42).
Listing 36.14 and Listing 36.15 aggregate the sample mean, or both the sample mean and the sample standard deviation sd, of the numeric mark in the point-pattern-list pppL_num (Listing 36.2) and return a numeric vector-list (vectorlist, Chapter 42).
Listing 36.14: Example: function aggregate_marks.ppplist(), for sample mean (Listing 36.2)
Listing 36.16 aggregates the relative frequencies of the multi-type mark in the point-pattern-list pppL_mt (Listing 36.4). Note that Listing 36.16 returns a numeric list, but not a vectorlist (Chapter 42).
Listing 36.16: Example: function aggregate_marks.ppplist(), for relative frequencies (Listing 36.4)
Listing 36.17 creates a point-pattern-list by duplicating the point-pattern betacells (Section 9.4), aggregates the numeric mark area by the multi-type mark type using the sample mean and the sample standard deviation sd, and returns a numeric vector-list (vectorlist, Chapter 42).
Listing 36.17: Example: function aggregate_marks.ppplist(), for sample mean and sd of area-by-type
spatstat.geom::solist( spatstat.data::betacells, spatstat.data::betacells) |>aggregate_marks(by = area ~ type, FUN = \(z) c(mean =mean(z), sd =sd(z)))# A 'vectorlist' of 2 vectors # Storage Mode: numeric # Individual Vector Length: 4
Listing 36.18 creates a point-pattern-list by duplicating the point-pattern gorillas (Section 9.13), aggregates one multi-type mark season by another multi-type mark group using the relative frequencies, and returns a numeric vector-list (vectorlist, Chapter 42).
Listing 36.18: Example: function aggregate_marks.ppplist(), for relative frequencies of season-by-group
spatstat.geom::solist( spatstat.data::gorillas, spatstat.data::gorillas) |>aggregate_marks(by = season ~ group, FUN = \(z) table(z)/length(z))# A 'vectorlist' of 2 vectors # Storage Mode: numeric # Individual Vector Length: 4
Listing 36.19 shows that the S3 method t.vectorlist() (Section 42.3) is the fastest way to extract a “slice” from the returned numeric-vectorlist.
Listing 36.19: Advanced: function t.vectorlist()
spatstat.geom::solist( spatstat.data::gorillas, spatstat.data::gorillas) |>aggregate_marks(by = season ~ group, FUN = \(z) table(z)/length(z)) |>t.vectorlist()# A 'vectorlist' of 4 vectors # Name(s): major.season.dry, major.season.rainy, minor.season.dry, minor.season.rainy # Storage Mode: numeric # Individual Vector Length: 2
36.5 Group-Generic of Numeric Mark(s)
36.5.1Math
The S3 method Math.ppplist()
applies the S3 method Math.ppp() (Section 35.3.1) to all point-patterns of the input point-pattern-list;
returns a point-pattern-list.
The S3 method Math.ppplist(), as well as the S3 method Math.fvlist() (Section 20.7.1), serves a similar purpose (Table 36.2) to the S3 method Math.imlist() (v3.7.0.8).
Table 36.2: Functions Math.ppplist(), Math.fvlist() and Math.imlist()
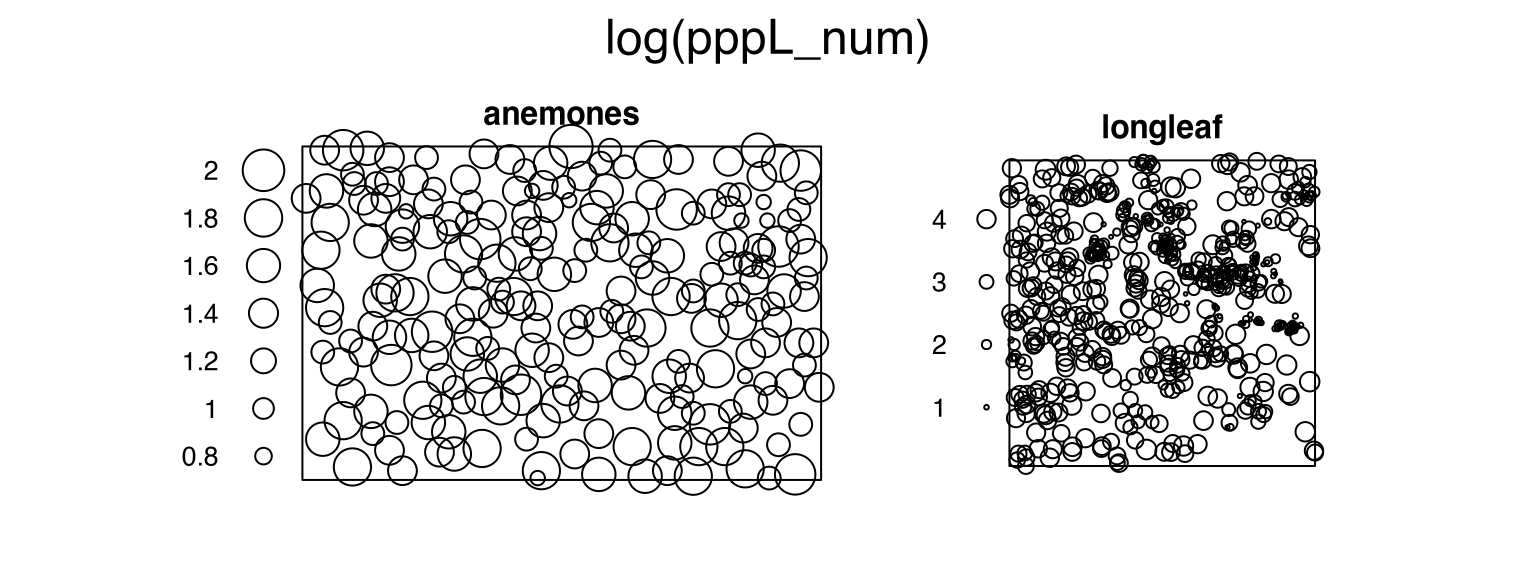
Listing 36.20 applies the log-transformation on the numeric marks of each point-pattern in the point-pattern-list pppL_num (Listing 36.2, Figure 36.1) and visualize the result in Figure 36.3.
Listing 36.20: Figure: log-transformed numeric marks in pppL_num (Listing 36.2)
Figure 36.3: log-transformed numeric marks in pppL_num (Listing 36.2)
36.5.2Summary
The S3 method Summary.ppplist()
applies the S3 method Summary.ppp() (Section 35.3.2) to all point-patterns of the input point-pattern-list;
returns a list.
The S3 method Summary.ppplist(), as well as the S3 method Summary.fvlist() (Section 20.7.2), serves a similar purpose (Table 36.3) to the S3 method Summary.imlist() (v3.7.0.8).
The S3 method split.pppkmlist() splits a pppkmlist by the \(k\)-means clustering indices of each 'pppkm' member. The returned object is assigned with additional attributes,
attr(,'id'), indices of the point-patterns before splitting.
attr(,'cluster'), indices of \(k\)-means clusters, nested in id.
pppL_num |>rlabelRes(fun = spatstat.explore::Kmark, f =`*`) |>global_envelope_test_()# anemones:# Global envelope test (1d):# * Based on the measure: "erl"# * 95% global envelope# * p-value of the global test: 0.01# * Significance level of the global test: 0.05# * Number of r with observed function outside the envelope: 424# * Total number of argument values r : 513# The object contains: # $r - Argument values : num [1:513] 0 0.0879 0.1758 0.2637 0.3516 ...# $obs - Observed function : num [1:513] 0 0 0 0 0 0 0 0 0 0 ...# $central - Central function : num [1:513] 0 0 0 0 0 0 0 0 0 0 ...# $lo - Lower boundary of the global envelope: num [1:513] 0 0 0 0 0 0 0 0 0 0 ...# $hi - Upper boundary of the global envelope: num [1:513] 0 0 0 0 0 0 0 0 0 0 ...# # longleaf:# Global envelope test (1d):# * Based on the measure: "erl"# * 95% global envelope# * p-value of the global test: 0.01# * Significance level of the global test: 0.05# * Number of r with observed function outside the envelope: 508# * Total number of argument values r : 513# The object contains: # $r - Argument values : num [1:513] 0 0.0977 0.1953 0.293 0.3906 ...# $obs - Observed function : num [1:513] 0 0 0 -0.401 -0.783 ...# $central - Central function : num [1:513] 0 0 0 0 0 0 0 0 0 0 ...# $lo - Lower boundary of the global envelope: num [1:513] 0 0 0 -0.384 -0.801 ...# $hi - Upper boundary of the global envelope: num [1:513] 0 0 0 1.03 1.91 ...
Listing 36.25 performs the random re-labelling envelope residual and test on the point-pattern-list pppL_mt (Listing 36.4).
pppL_mt |>rlabelRes(fun = spatstat.explore::Gcross) |>global_envelope_test_()# ants:# Global envelope test (1d):# * Based on the measure: "erl"# * 95% global envelope# * p-value of the global test: 0.02# * Significance level of the global test: 0.05# * Number of r with observed function outside the envelope: 122# * Total number of argument values r : 513# The object contains: # $r - Argument values : num [1:513] 0 0.297 0.594 0.891 1.188 ...# $obs - Observed function : num [1:513] 0 0 0 0 0 0 0 0 0 0 ...# $central - Central function : num [1:513] 0 0 0 0 0 0 0 0 0 0 ...# $lo - Lower boundary of the global envelope: num [1:513] 0 0 0 0 0 0 0 0 0 0 ...# $hi - Upper boundary of the global envelope: num [1:513] 0 0 0 0 0 0 0 0 0 0 ...# # hyytiala:# Global envelope test (1d):# * Based on the measure: "erl"# * 95% global envelope# * p-value of the global test: 0.75# * Significance level of the global test: 0.05# * Number of r with observed function outside the envelope: 0# * Total number of argument values r : 513# The object contains: # $r - Argument values : num [1:513] 0 0.0181 0.0363 0.0544 0.0725 ...# $obs - Observed function : num [1:513] 0 0 0 0 0 0 0 0 0 0 ...# $central - Central function : num [1:513] 0 0 0 0 0 0 0 0 0 0 ...# $lo - Lower boundary of the global envelope: num [1:513] 0 0 0 0 0 0 0 0 0 0 ...# $hi - Upper boundary of the global envelope: num [1:513] 0 0 0 0 0 0 0 0 0 0 ...
36.9 Batch Process on Eligible Marks
The S3 methods Emark_.ppplist(), Vmark_.ppplist(), etc., in Table 36.1,
collects the return of the corresponding S3 method in Table 35.22, for each point-pattern (ppp.object, Chapter 35) in the input point-pattern-list;
organizes these returns into a list-of-fvlist (Chapter 20) per numeric mark, e.g., Listing 36.26.
The S3 methods Gcross_.ppplist(), Kcross_.ppplist(), etc., in Table 36.1,
collects the return of the corresponding S3 method in Table 35.24, for each point-pattern (ppp.object, Chapter 35) in the input point-pattern-list;
organizes these returns into a list-of-fvlist (Chapter 20) per multi-type mark, e.g., Listing 36.27.
collects the return of the corresponding S3 method in Table 35.25, for each point-pattern (ppp.object, Chapter 35) in the input point-pattern-list;
organizes these returns into a list-of-anylist (Chapter 14) per multi-type mark, e.g., Listing 36.28.
The low-level utility function op_ppplist(), for batch operation on ppplist, is the underlying mechanism of the batch processes (Section 2.2). Function op_ppplist()
applies the operation to each point-pattern (ppp.object, Chapter 35) in the input point-pattern-list, and returns a two-level hierarchical list, the first level corresponds to the individual point-patterns, and the second level corresponds to the eligible numeric marks (for operations in Table 35.22) or eligible multi-type marks (foroperations in Table 35.24 and Table 35.25);
‘flips’ the hierarchy, such that the first level represents the eligible marks, and the second level corresponds to the individual point-patterns.
Listing 36.26: Example: function markcorr_.ppplist() (Listing 36.6)
betacells_type |>markcorr_()# $area# An 'fvlist' of 2 fv.objects k[mm](r) # Name(s): off, on # Available rmax: 187.5 # Minimum Legal rmax: 187.5
Listing 36.27: Example: function Gcross_.ppplist()